Calculating the overall risk
Several factors determine how Hyperproof calculates the overall risk.
Likelihood and impact are factored into the inherent risk.
Inherent risk, control impact, and control health are factored into the residual risk. If used, the mitigation percentage is also factored into the residual risk.
The overall risk is determined by comparing the tolerance to the residual risk.
Step one: Determine the inherent likelihood and the inherent impact
Both inherent likelihood and inherent impact are based on a five-point scale with qualitative and quantitative representations:
Very high (5)
High (4)
Moderate (3)
Low (2)
Very low (1)
Step two: Determine the inherent risk
The inherent risk is calculated as inherent likelihood x inherent impact.
For example, if the inherent likelihood of a risk is very high (5) and the inherent impact is very low (1), the inherent risk is very high (5).
Step three: Set the mitigation
Mitigation is determined by the user on a control by control basis.
Step four: Determine the residual likelihood and the residual impact
The residual likelihood is calculated as inherent likelihood x (1 - likelihood mitigation percentage).
The residual impact is calculated as inherent impact x (1 - impact mitigation percentage).
Step five: Determine the residual risk
The residual risk is calculated as residual likelihood x residual impact. If a control isn’t healthy, it's not doing its job of mitigating the risk!
Step six: Determine the overall risk
The overall risk is determined by comparing the tolerance to the residual risk.
Tolerance is set on a risk by risk basis and is determined by the risk owner (or organization administrator). Hyperproof's default tolerance scale is:
Very high (5)
High (4)
Moderate (3)
Low (2)
Very low (1)
Not set (i.e. no tolerance level)
Custom risk mapping
Administrators have the option to customize risk mapping, i.e. changing the point scale to better suit the organization.
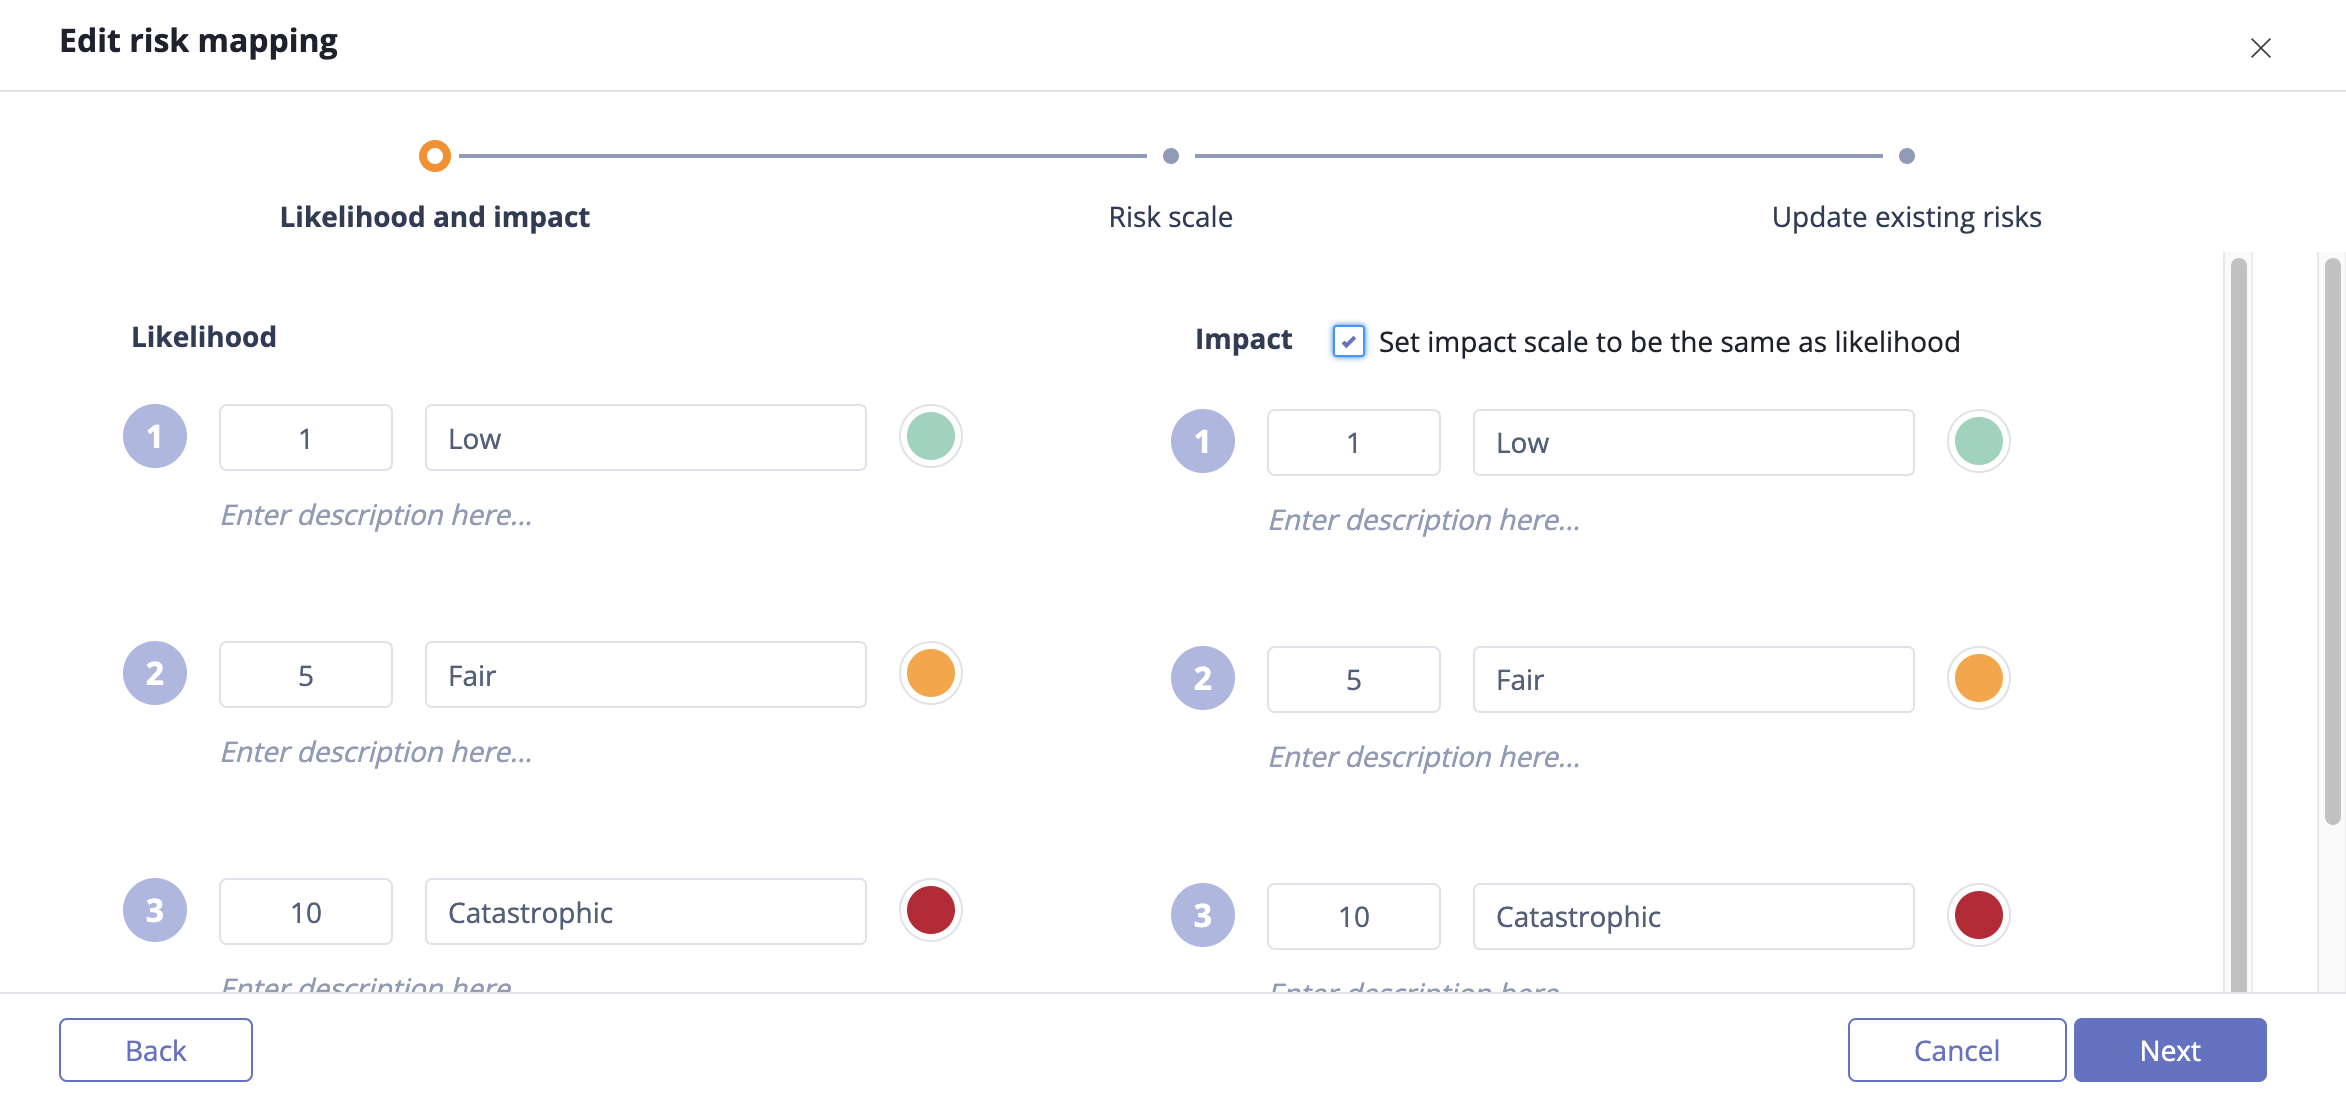
The risk scale can have 3 to 10 levels with custom point values. Note that Hyperproof only accepts integer values; it does not accept a range of values. For example, an organization might choose a 3-point likelihood scale and a 3-point impact scale. They might decide on the following values:
Low (1)
Fair (5)
Catastrophic (10)

Likelihood and impact custom risk mapping
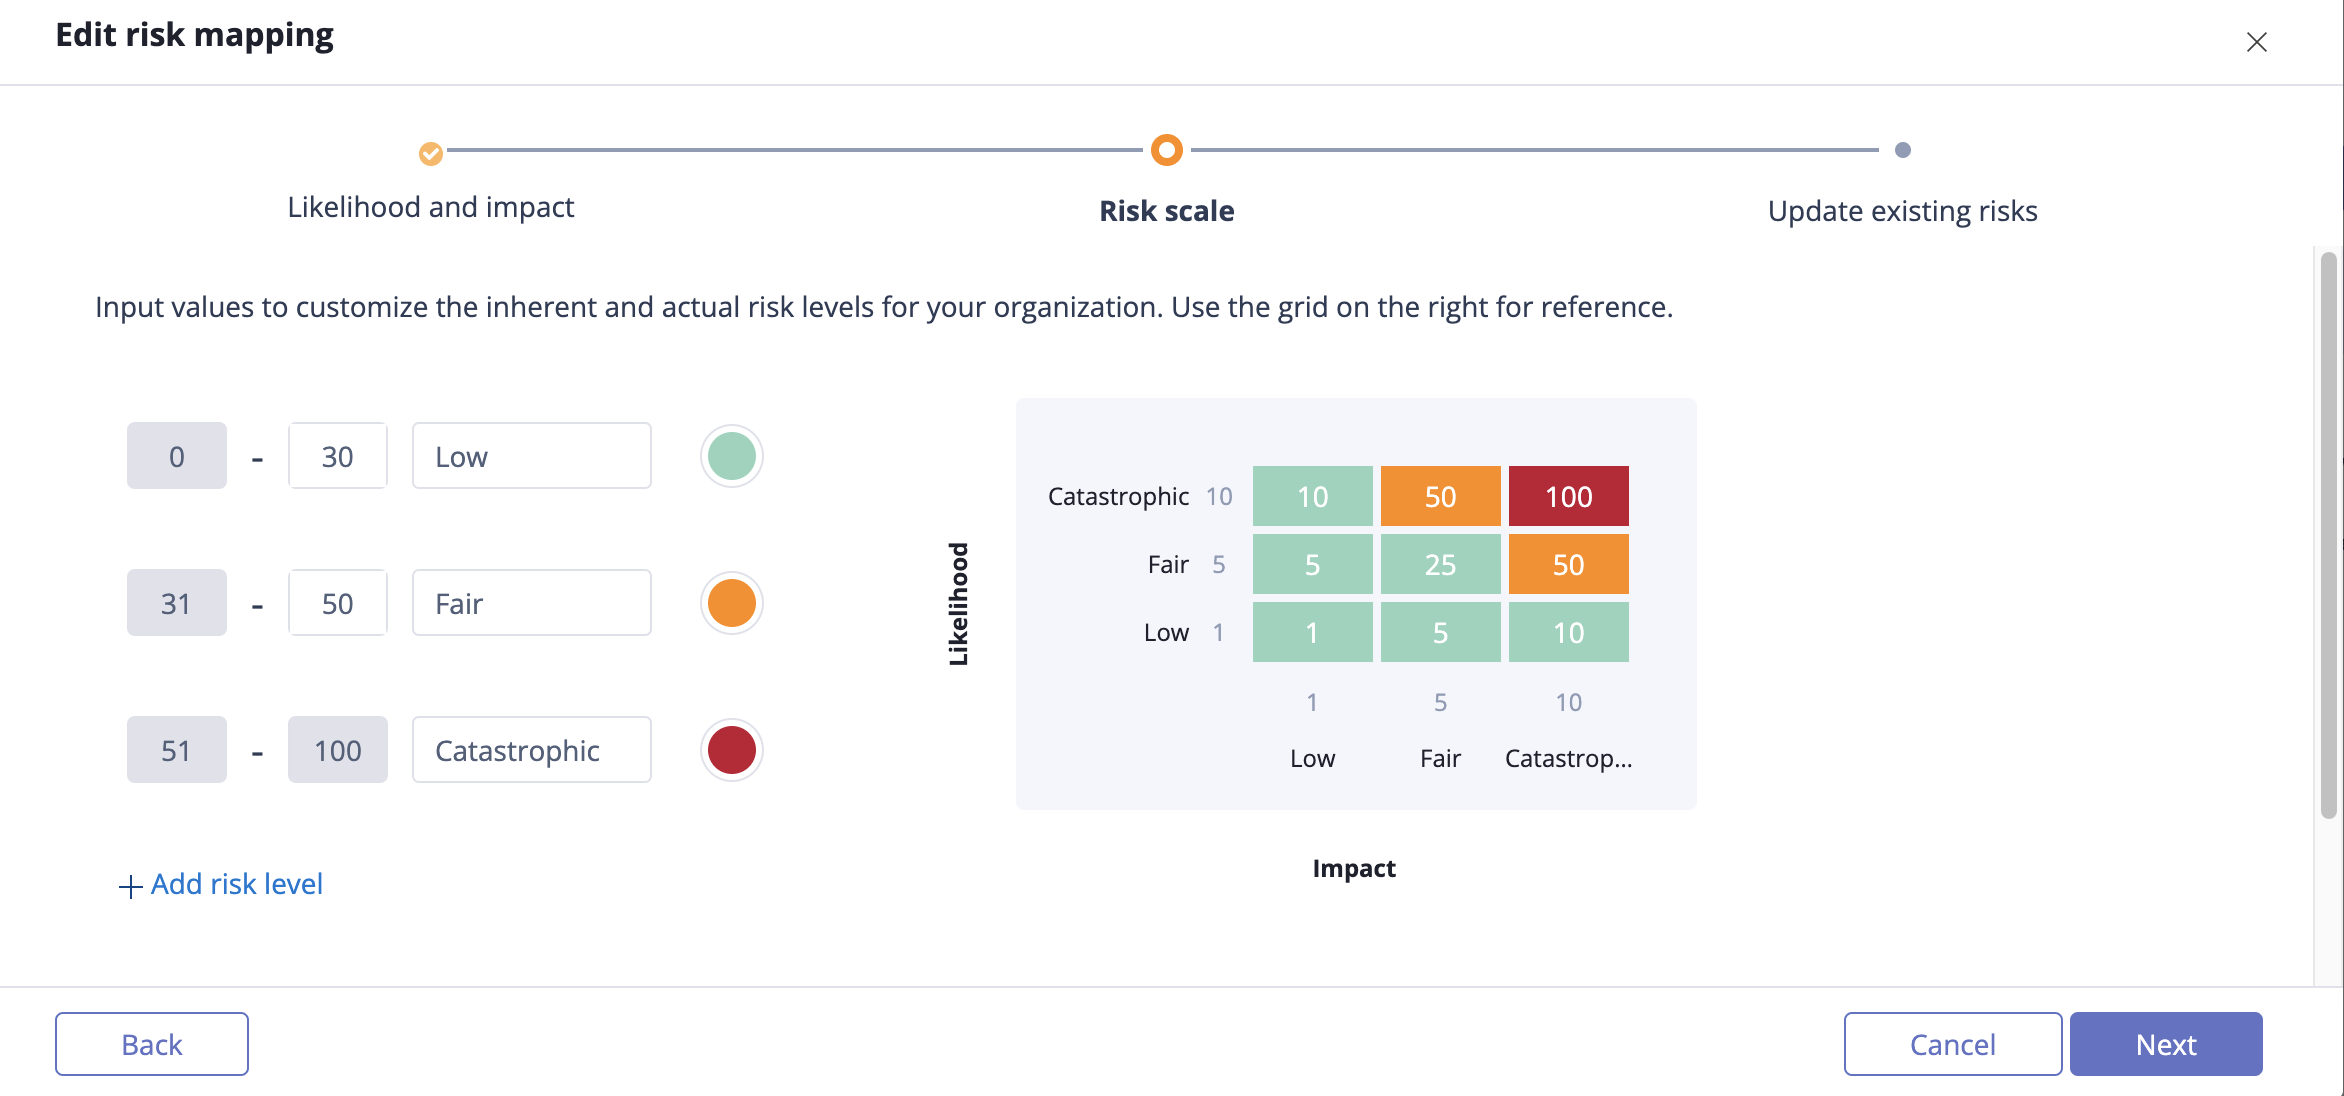
The applicable values for each risk level can be adjusted, as shown below with 0 to 30, 31 to 50, and 51 to 100 groupings.

Custom risk scale
Refer to Customizing the Risk Register for more information.