Risk Register widgets
Risk summary
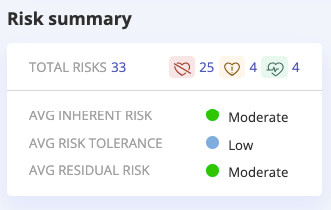
This snapshot shows:
Your organization’s total number of risks
The number of Healthy, At Risk, and Critical risks
The status of the average Inherent Risk, Risk Tolerance, and Actual Risk
Residual risk
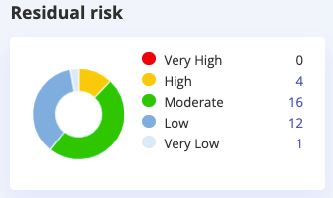
The Residual risk is the amount of risk remaining once a mitigating control (or multiple mitigating controls) have been applied. This amount is automatically calculated based on existing inputs, including the level of Inherent risk, the mitigation factor of any controls you linked to the risk, and the health status of linked controls.
Here is a breakdown of how Hyperproof determines the risk amount:
If a control is Healthy, 100% of the mitigation factor is attributed to the risk.
If a control is At risk, 50% of the mitigation factor is attributed to the risk.
If a control is Critical, 0% of the mitigation factor is attributed to the risk.
If the total of all mitigation factors of linked controls is 100%, and all controls are Healthy, the Actual risk will be very low.
If the sum of all mitigation factors of linked controls is 0%, or all linked controls are Critical, the Actual risk will be the same as the Inherent risk.
For more information, refer to Calculating the overall risk.
Response
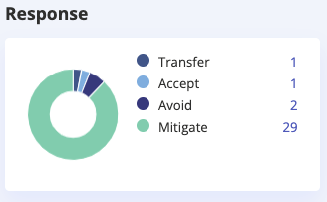
This snapshot displays how your organization chooses to address its risks.
Transfer - Risks that have been turned over to another party
Accept - Risks that have been accepted because their repercussions aren’t considerable
Avoid - Risks that are intended to be averted; no controls are put in place
Mitigate - Risks with controls to avoid adverse repercussions
Risk health

Based on your total number of risks, this snapshot provides an overview of whether the Actual risk meets, remains below, or exceeds your Risk tolerance.
Controls
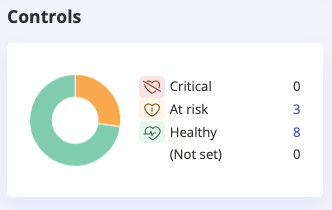
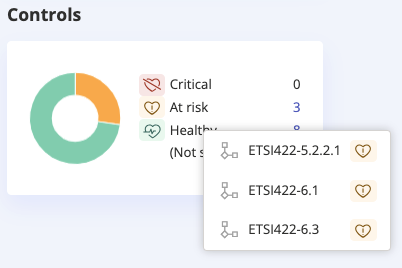
This widget displays the number of controls, by status, that are linked to risks.
The numbers are clickable links. When you click a link, you can view a list of the controls associated with that particular status. Clicking a control ID takes you to an overview of the control.
Risk heatmap
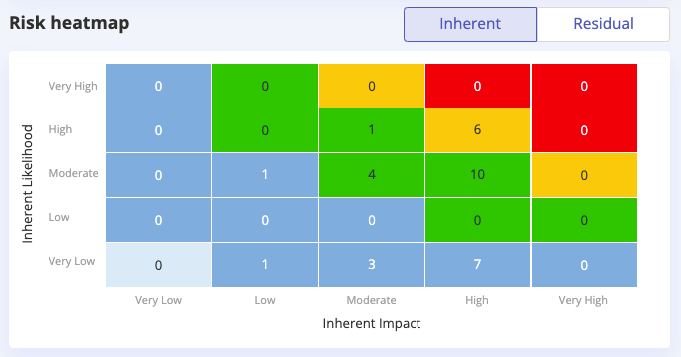
This snapshot shows a graphical representation of your risks presented as a heatmap. The Likelihood and Impact are mapped to an Inherent risk value.
Explore by panel
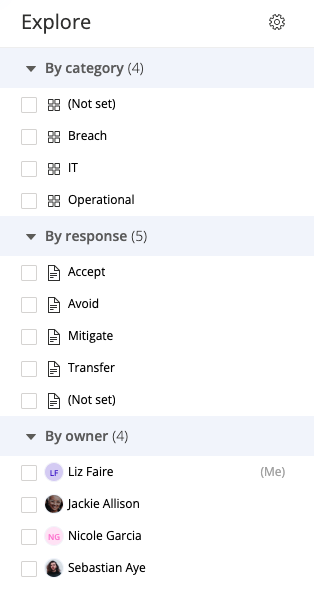
The Explore by panel allows you to view risk snapshots based on the following filters: Category, Response, Owner, and Group.
For example, you might want to assess the risks associated with a particular risk category, e.g. Operational. To do so, select the checkbox next to that category. Once the checkbox is selected, you’ll see the snapshots update.