Understanding the audit dashboard
Roles and permissions
The following roles can view an audit dashboard:
Administrators and compliance managers can view all audit dashboards
Anyone who is a member of an audit, regardless of their object role, can view the audit dashboard for that audit
The audit dashboard is similar to the program dashboard. As with programs, every audit has its own dashboard that displays pertinent information applicable to the audit, such as progress and readiness.
Tip
For more information, see the Audit dashboard video at the bottom of the page.
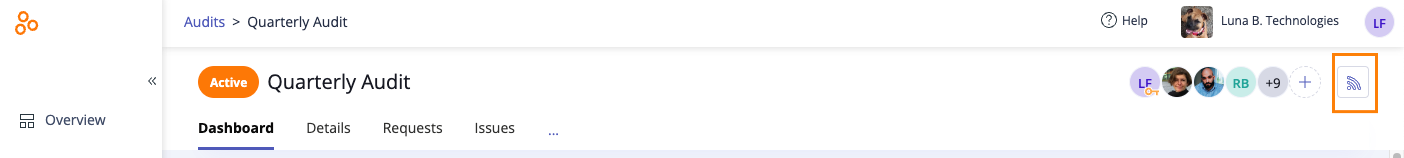
Accessing an audit
After signing in to Hyperproof, you can access an audit via the Audits tab. From the left menu, select Audits, and then select the audit.
Summary
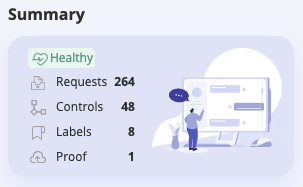
This is an overall snapshot of the audit. The number of all requests, controls and control scopes, labels, and proof that have been imported into the audit appears here. The audit's health status is also available here.
Note
Control scopes are included in the Controls count on the dashboard.
Audit timeline
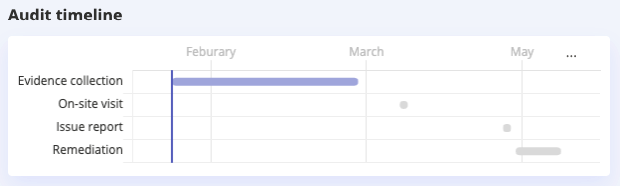
The audit timeline is designed to keep the entire team up-to-date during the audit process. It provides a quick view as to when particular events within the process will take place.
To edit the timeline, click … (More options), then click Edit. Adjust the values to match your organization’s audit, then click Save.
Tip
You can also view the audit's Activity Feed for additional timeline information. Click the Activity Feed icon in the upper-right corner of the audit dashboard.
Progress
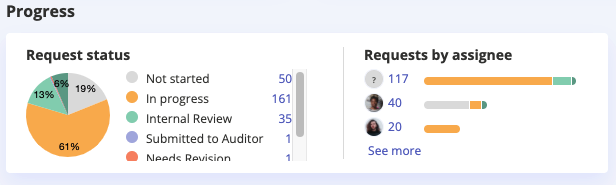
Request status
This snapshot provides a general overview of the progress of your audit.
Not started - Requests that have not yet been started
In progress - Requests that are currently being worked on
Internal review - Requests that are currently under internal review
Submitted to auditor - Requests that have been submitted to the auditor for review
Needs revision - Requests that the auditor reassigns to the organization to be revised
Approved - Requests that have been verified and accepted
Closed - Requests that have been completed and closed
Requests by assignee
View the progress of the audit based on the assignee. Next to each assignee is the number of requests assigned to them and a progress bar indicating whether their requests are In progress, Submitted, Closed, or Not started.
Stale requests
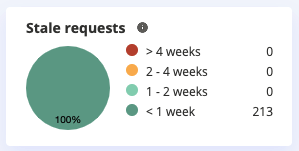
This widget illustrates requests that have not yet been started, or are in progress but have not been worked on in quite some time. Hyperproof takes the following request statuses into account: In progress, Internal review, and Needs revision.
Color chart breakdown:
Dark green - Requests that haven't been worked on in less than 1 week
Light green - Requests that haven't been worked on in 1 to 2 weeks
Orange - Requests that haven't been worked on in 2 to 4 weeks
Red - Requests that haven't been worked on in more than 4 weeks
Audit readiness
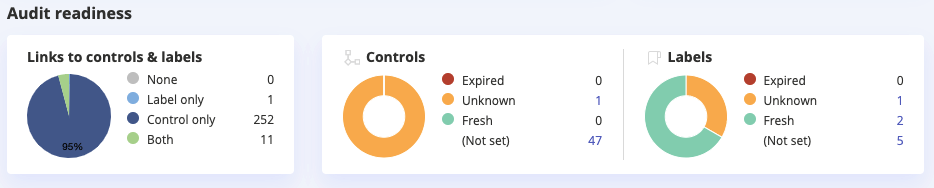
Links to controls and labels
This pie chart shows an overview of the number of requests linked to both controls and labels.
Controls
This snapshot displays controls linked to requests within the audit. The freshness status of each control is also displayed.
Labels
Requests linked to labels within the audit are displayed in this widget.
Issues
This pie chart shows the number of issues (and their statuses) linked to requests within the audit.