Program dashboard widgets
Roles and permissions
The following users can access the program dashboard widgets:
Anyone who is a member of the program.
Overview section
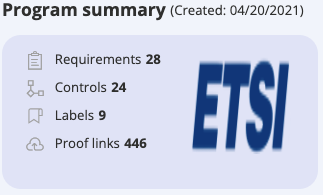
Program summary
Contains basic information about your program, including the date created and the total number of requirements, controls, labels, and proof associated with the program.
Tip
In Hyperproof, it's common to link the same piece of proof to multiple controls, thus generating multiple links per piece of proof.
The 'Proof links' number represents links to the unique pieces of proof in your program. Thus, the number in this program dashboard widget might differ from the number on the Programs page.
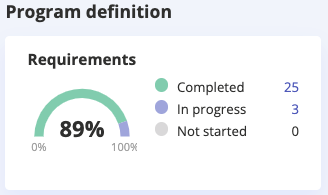
Program definition
Helps you assess whether your program has been fully configured by displaying the percentage and number of completed and incomplete requirements. These numbers correspond with the status of each requirement (Requirement > Details).
Completed - The number of requirements in the program that have been completed.
In progress - The number of requirements in the program that are currently being worked on.
Not started - The number of requirements in the program that have not been worked on.
Not applicable - The number of requirements irrelevant to the program.
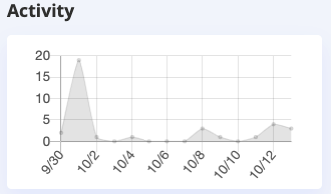
Activity
Displays the level of activity in the program over the past 14 days.
Tip
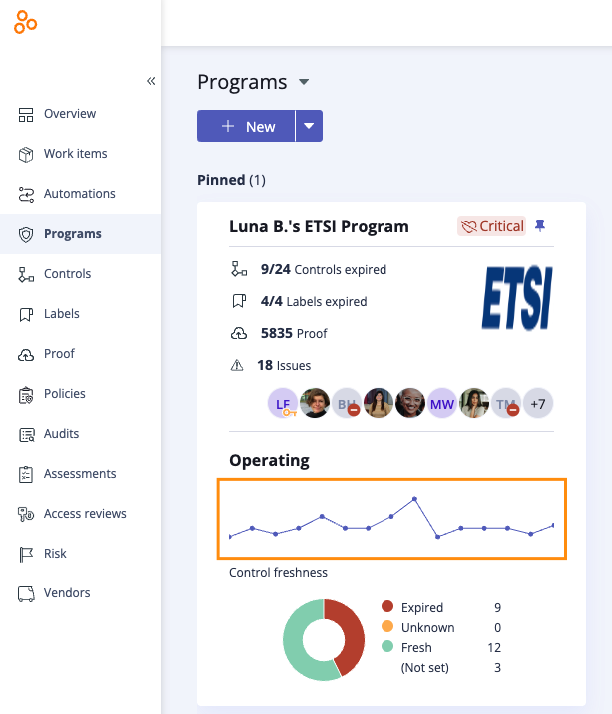
A visual representation of activities within a particular program over the past two months can be found on the Programs page. Note that the program must be pinned to see the chart.
SPRS section
Note
This section displays only for programs that support SPRS scoring. For more information, see Working with SPRS scoring.
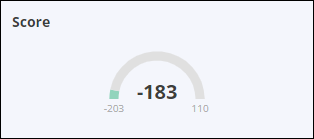
The SPRS score widget shows your total SPRS score based on the points earned for implemented requirements, and the range of scores from -203 to 110. The SSP label indicates whether or not you have SSP implemented. The value is based on the implementation status of Requirement 3.12.4, indicating that your organization has or has not implemented SSP. Requirement 3.12.4 is unweighted.
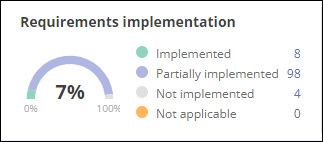
The Requirements implementation widget shows the percentage of requirements that are implemented and the total requirements in each implementation status. Click on a total for a filtered list of requirements in that status.
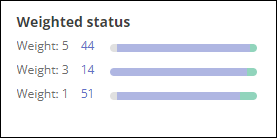
The Weighted status widget shows the total number of requirements for each possible SPRS weight and the number of requirements in the group with a status of Implemented, Partially implemented, and Not implemented. Hover over the different color segments for a tooltip with the corresponding status totals.
Controls section
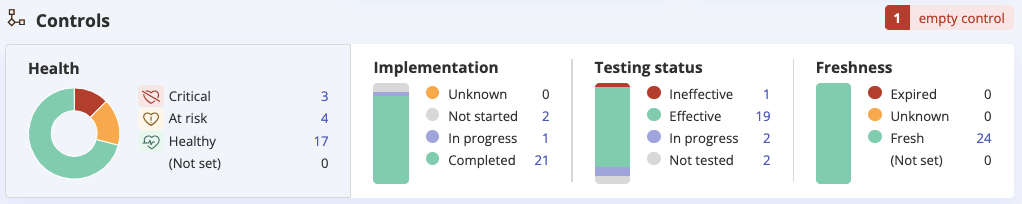
Health
Shows the number of healthy, at-risk, and critical controls. For more information on health, refer to Program health.
Implementation
Shows the status of the controls in the program.
Testing status
Shows the number of controls that have been tested.
Freshness
Shows the number of controls that are fresh and expired. This allows you to see if the program is up-to-date.
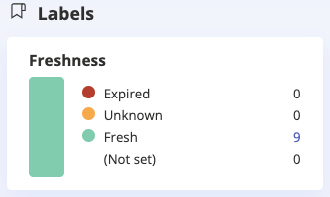
Labels section
The Freshness widget shows you if the labels in the program are fresh or up-to-date.
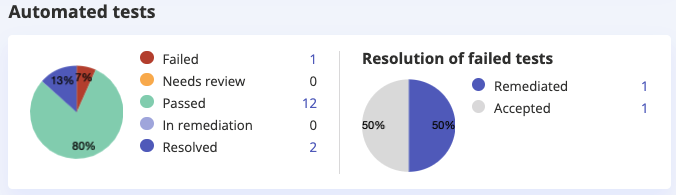
Automated tests section
In the Automated tests section, you get a snapshot of the status of the tests you’ve run on controls and labels. For failed tests, you can view a pie chart providing the number of tests you’ve remediated and accepted.
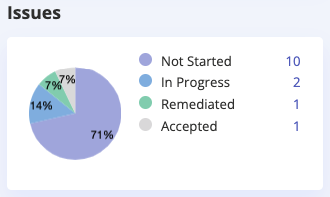
Issues section
Shows the number of issues that have been accepted and remediated, as well as the number that are currently being worked on or haven't yet been worked on.
Reuse section
Reuse controls
Shows the number of controls that have been reused in the program.
Reuse labels
Shows the number of labels (with linked proof) that have been reused in the program.