Example risk calculation
Example one: Inherent
In the calculation below, a risk is linked to two controls (Control A and Control B). Each control has a mitigation percentage of 40 percent. Both controls are healthy.
Using Hyperproof's default risk mapping, the calculation looks like:
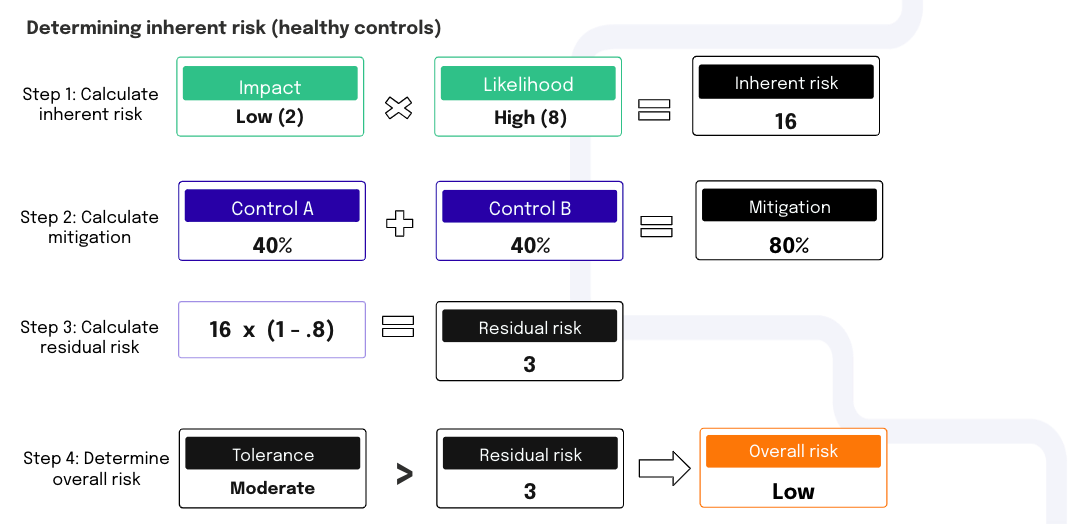
The overall risk is Low because the residual risk is less than the tolerance. Refer to Calculating the overall risk for more information.
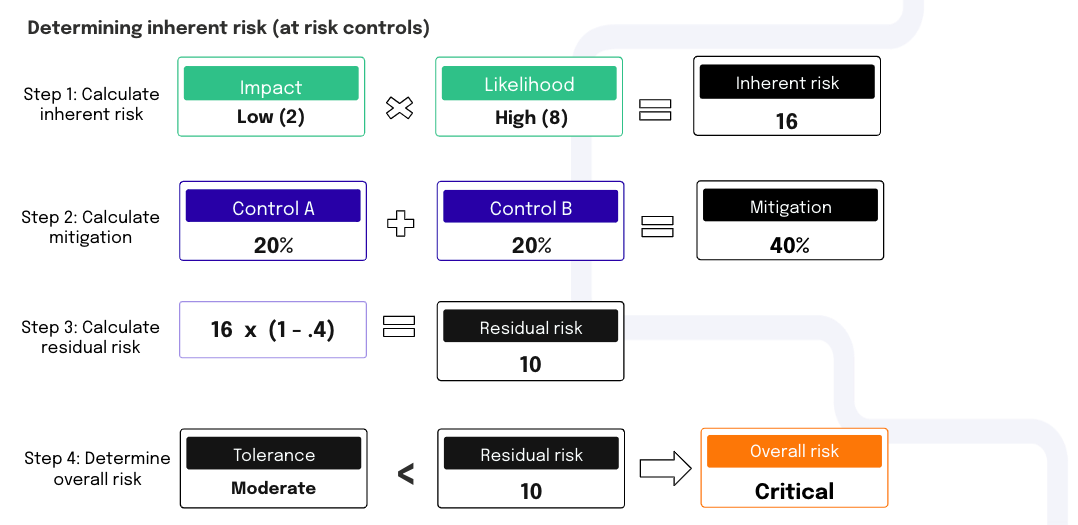
Example two: Inherent
Using the example calculation above, both controls failed testing and became at risk, thereby reducing their mitigation percentages. The intended mitigation was 40% per control, so after discounting by 50%, the resulting mitigation is 20% per control. The residual risk increases beyond the tolerance, so the risk becomes Critical.
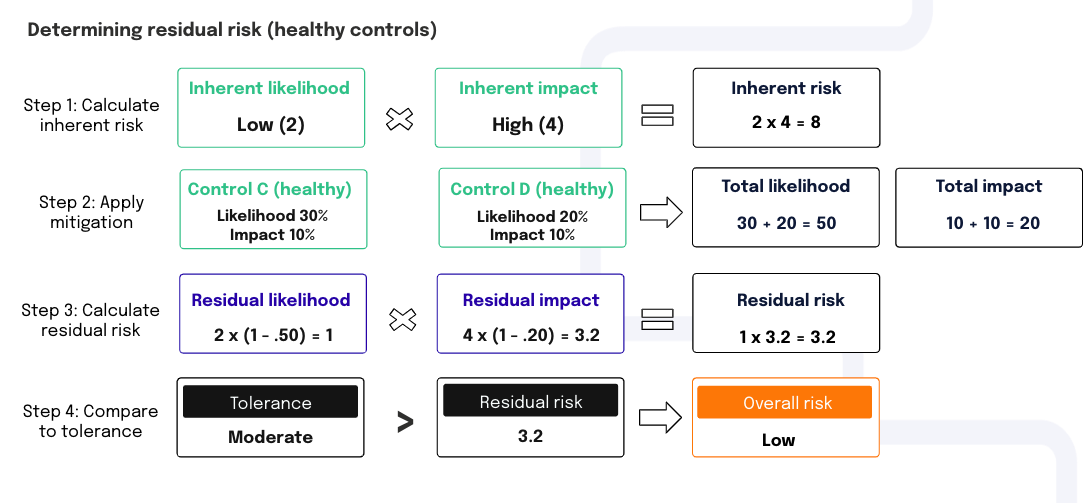
Example three: Residual
In the calculation below, a risk is linked to two controls (Control C and Control D). Control C has a likelihood mitigation of 30%, and Control D has a likelihood mitigation of 20 percent. Control C has an impact mitigation of 10%, and Control D has an impact mitigation of 10 percent. Both controls are healthy.
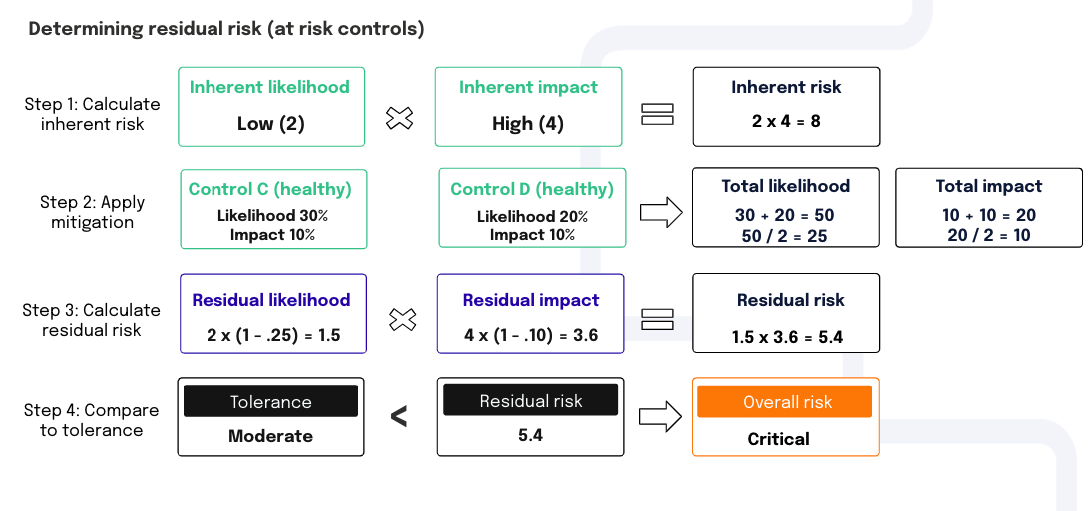
Example four: Residual
Using the example calculation above, both controls failed testing and became at risk, thereby reducing their mitigation percentages.
The intended likelihood mitigation was 50%, so after discounting it by 50%, the resulting likelihood mitigation is 25%. The intended impact mitigation was 20%, so after discounting it by 50%, the resulting impact mitigation is 10%. The residual risk exceeds the tolerance, so the risk becomes Critical.